

- Measuring customer retention through payment behavior across cohorts
- Identifying how many customers continue making payments at each billing cycle
Data presented in this report
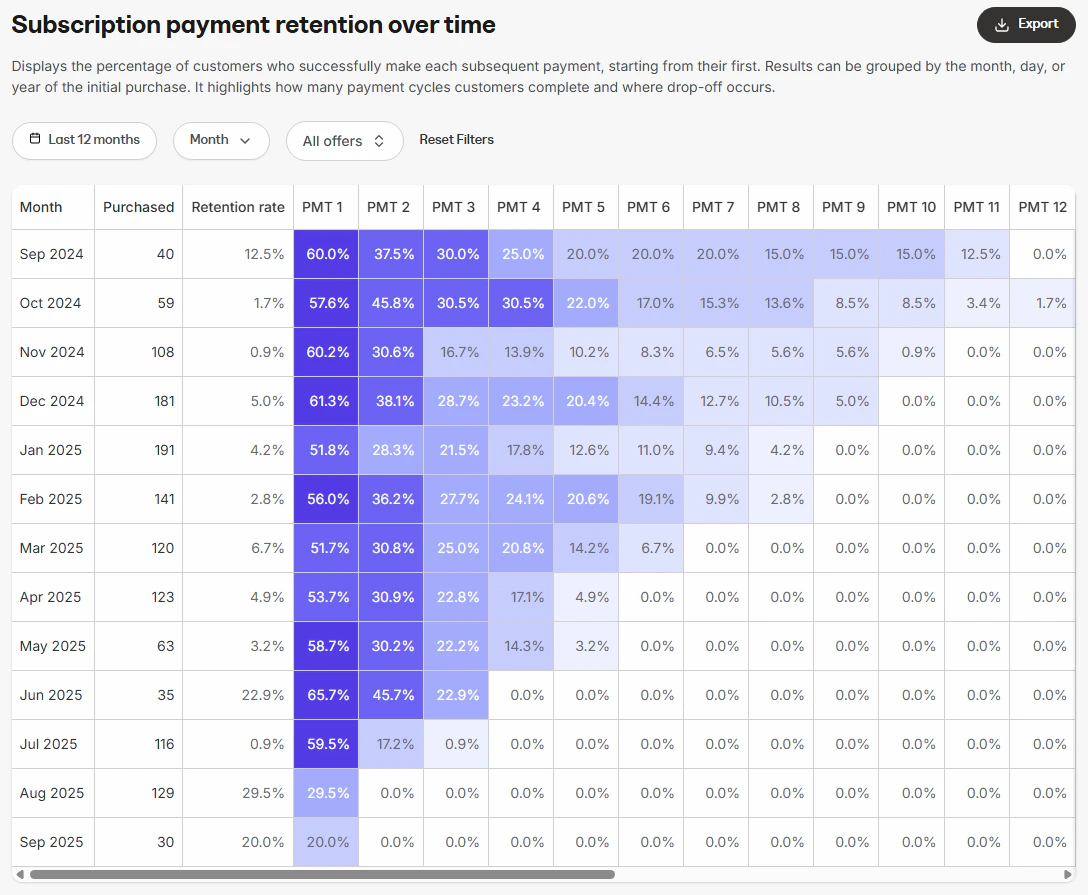
Data table (heatmap)
The data table provides a detailed cohort breakdown:- Month: The purchase month (or day/year, depending on interval filter)
- Purchased: The number of new subscriptions started in that period. The count is based on the original purchase date, regardless of any trial period
- Retention rate: The percentage of the original cohort who completed the latest payment
- PMT 1–24: Payment percentages after each payment cycle, up to 24. For example, PMT 1 shows how many customers completed after their first payment, PMT 2 after their second, and so on
How to use the report
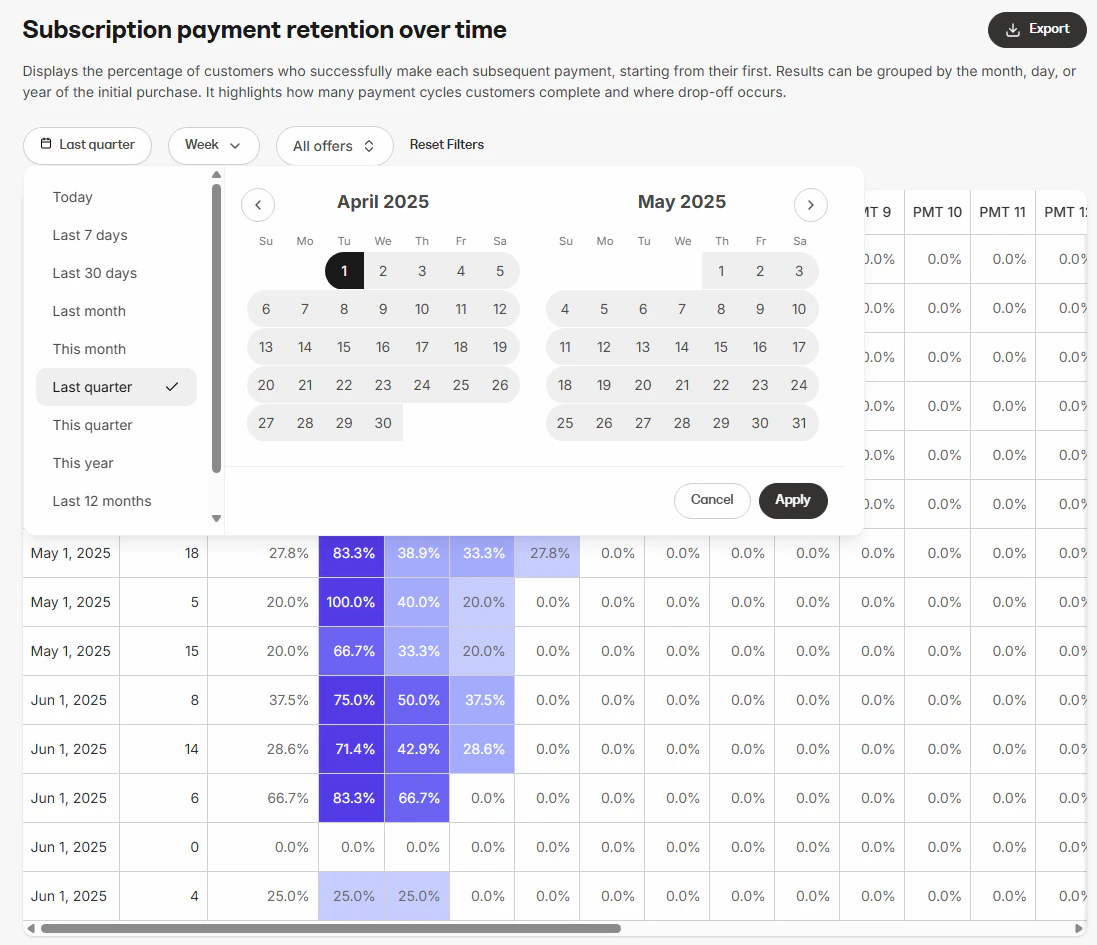
You can customize the data displayed in the report using several controls.Controls
- Time range: Select the timeframe for purchase cohorts included in the report (e.g., last 30 days, last 12 months, custom)
- Interval: Choose how cohorts are grouped (Day, Month, Year)
- Offer selection: View retention across all offers or focus on a specific offer
Export information
When you export the Subscription retention over time report, the resulting file will include the same columns and reflect any filters you have applied. This ensures the data in the export matches what is displayed in the report:- Month
- Purchased (amount)
- Retention rate
- Payments 1–24