- Tracking contact list growth over time
- Monitoring daily, weekly, or monthly fluctuations in new contacts
- Evaluating the impact of marketing campaigns, promotions, or offers on new sign-ups
Data presented in this report
Visual charts
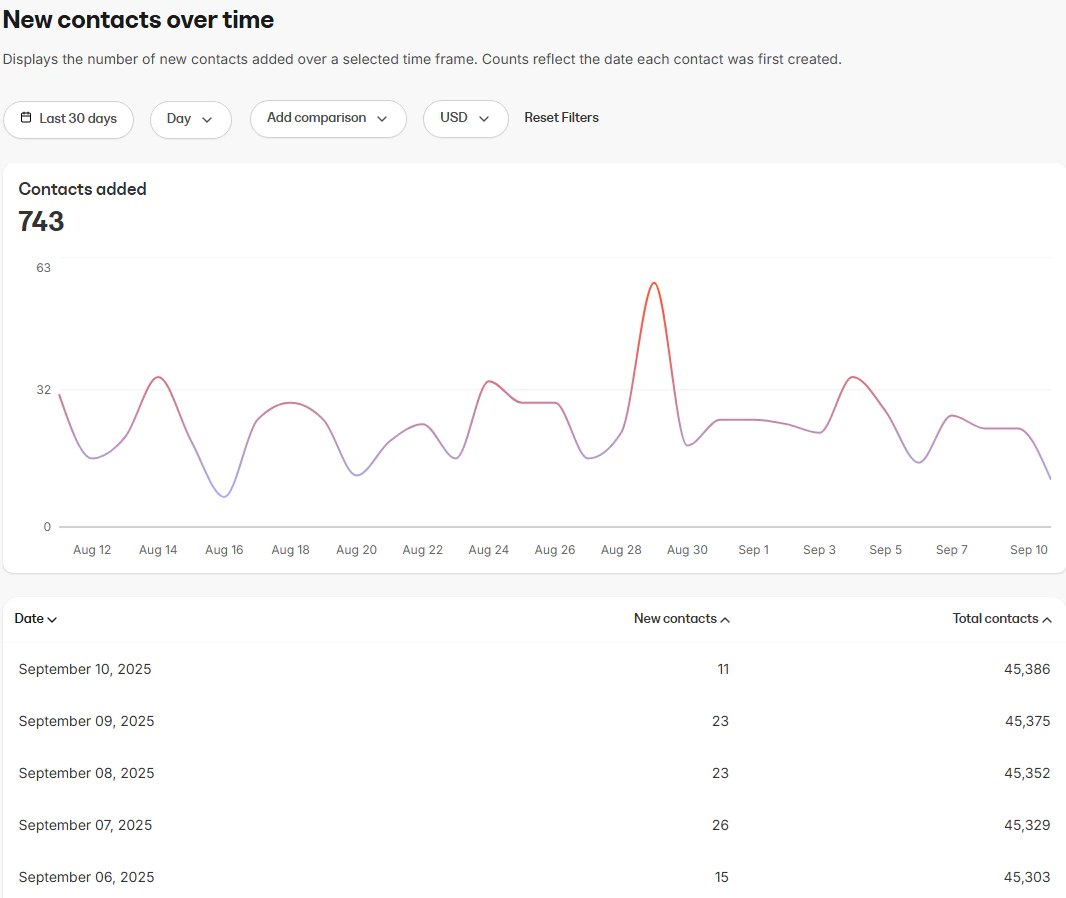
- Contacts added (line chart): Displays the number of new contacts added within the selected time frame
Data table
The data table provides a detailed breakdown of contact growth, including:- Date: The calendar date when contacts were added
- New contacts: The number of new contacts created on that date
- Total contacts: The running total number of contacts in your system
How to use the report
Controls
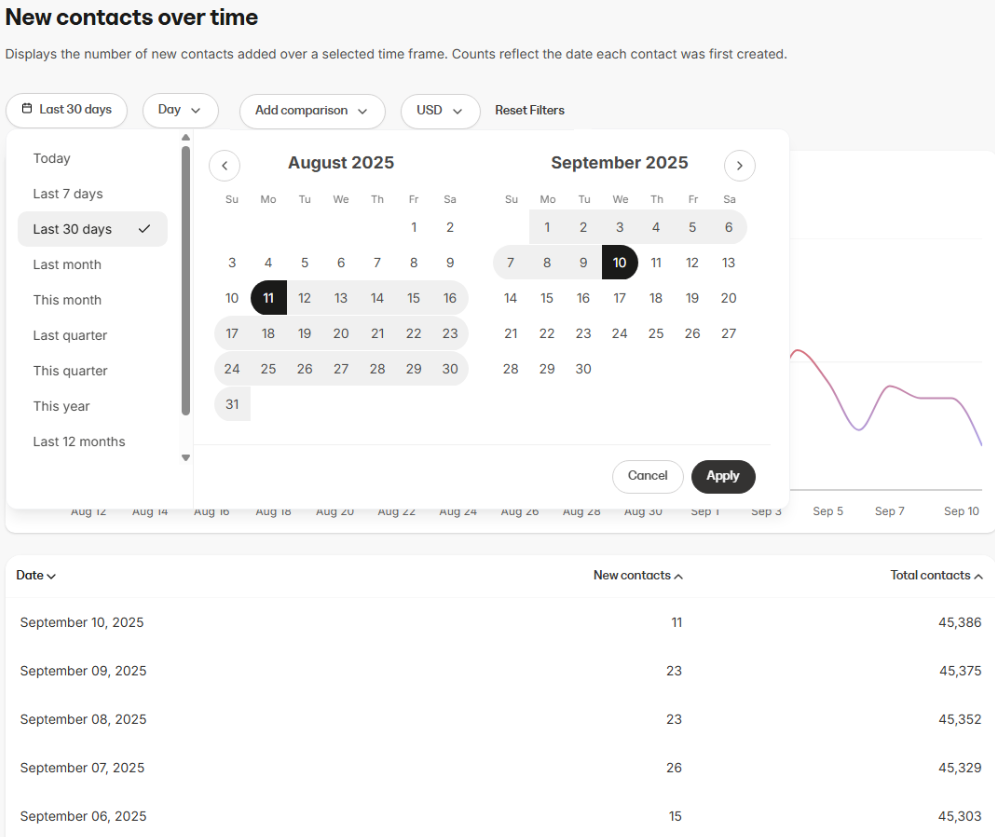
- Interval: Choose how the data is grouped within the selected time range (Day, Week, Month, Year)
- Currency selector: View stats in your preferred currency (if applicable)
- Comparison: Use the Add comparison option to compare new contact growth in the current period against a past period, making it easier to evaluate performance trends