

- Tracking overall offer purchase activity
- Measuring the revenue impact of first purchases versus returning purchases
- Understanding performance by pricing type
Data presented in this report
Visual charts
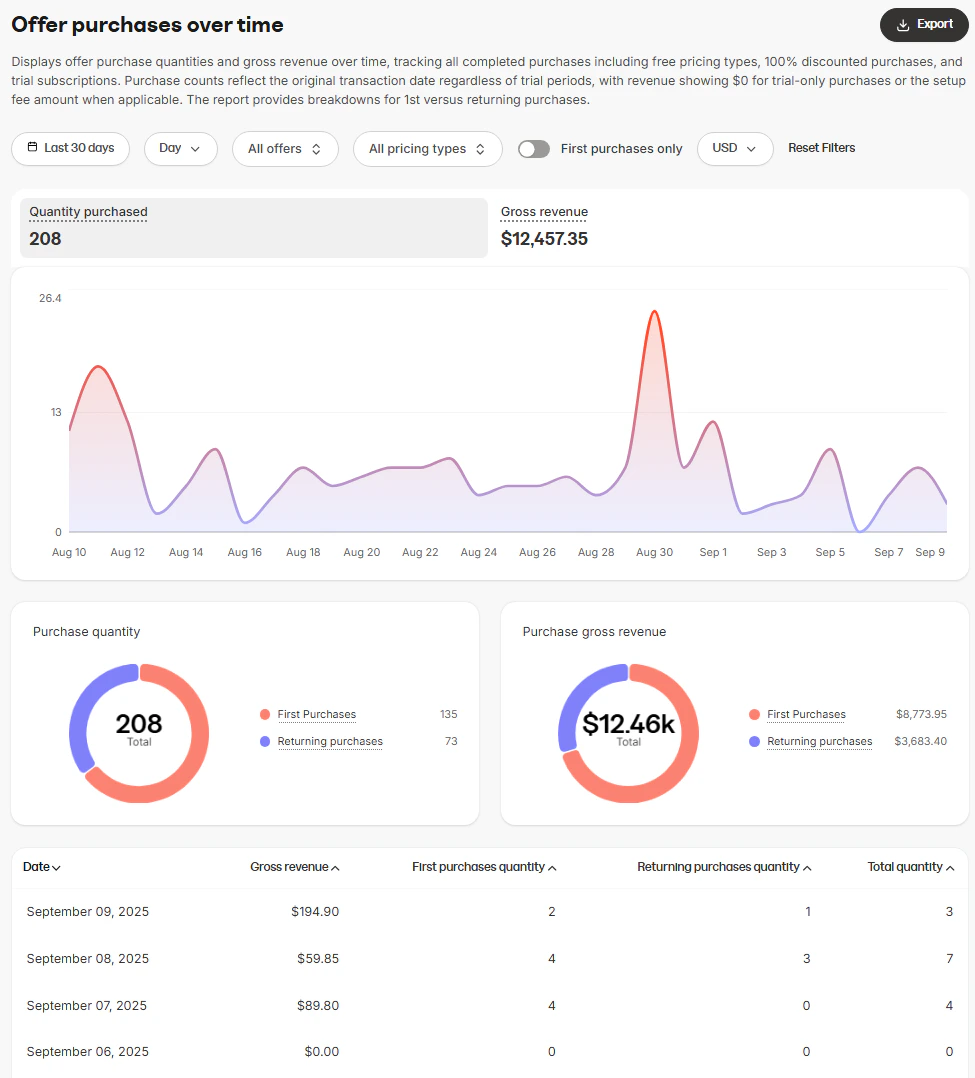
- Offer Purchases Over Time (line chart): Displays the total quantity and gross revenue of purchases over time
- Purchase Quantity (donut chart): Breaks down purchases by a customer’s first purchases versus returning purchases
- Purchase Gross Revenue (donut chart): Breaks down gross revenue by first purchases versus returning purchases
Data table
- Interval: The specific interval period (day, week, month, or year) across the time range selected
- Gross revenue: The total gross revenue earned from those purchases at the time of purchase
- First purchases quantity: The number of purchases made by new customers
- Returning purchases quantity: The number of purchases made by returning customers
- Total quantity: The total number of offers purchased
How to use this report
You can customize the data displayed in the report using several controls.- Time range: Filter payments by period (e.g., last 7 days, last 30 days, custom date range)
- Interval: Choose how the data is grouped within the selected time range (Day, Week, Month, Year)
- Offer selection: Choose whether to view data for multiple offers or a specific offer
- First purchases only: Limit the report to first purchases only
- Currency selector: View stats in your preferred currency
- Comparison: Compare current results against a past period
Export information
When you export the Offer Purchases Over Time report, the resulting file will include the same columns and reflect any filters you have applied. This ensures the data in the export matches what is displayed in the report:- Date
- Total quantity
- Gross revenue
- First purchases quantity
- First purchases gross revenue
- Returning purchases quantity
- Returning purchases gross revenue
- Currency