

View media statistics
Measure the performance of your media content and gain a better understanding of your visitors from their response to your audio and video. You can add video or audio content to your Website Pages, Landing Pages, Blog Posts, and Course Lessons to engage your audience. Learn to access your media stats:Media stats definitions
Your media stats will display in three sections:- Summary stats
- Engagement graph
- Information for individual sessions
Summary Stats
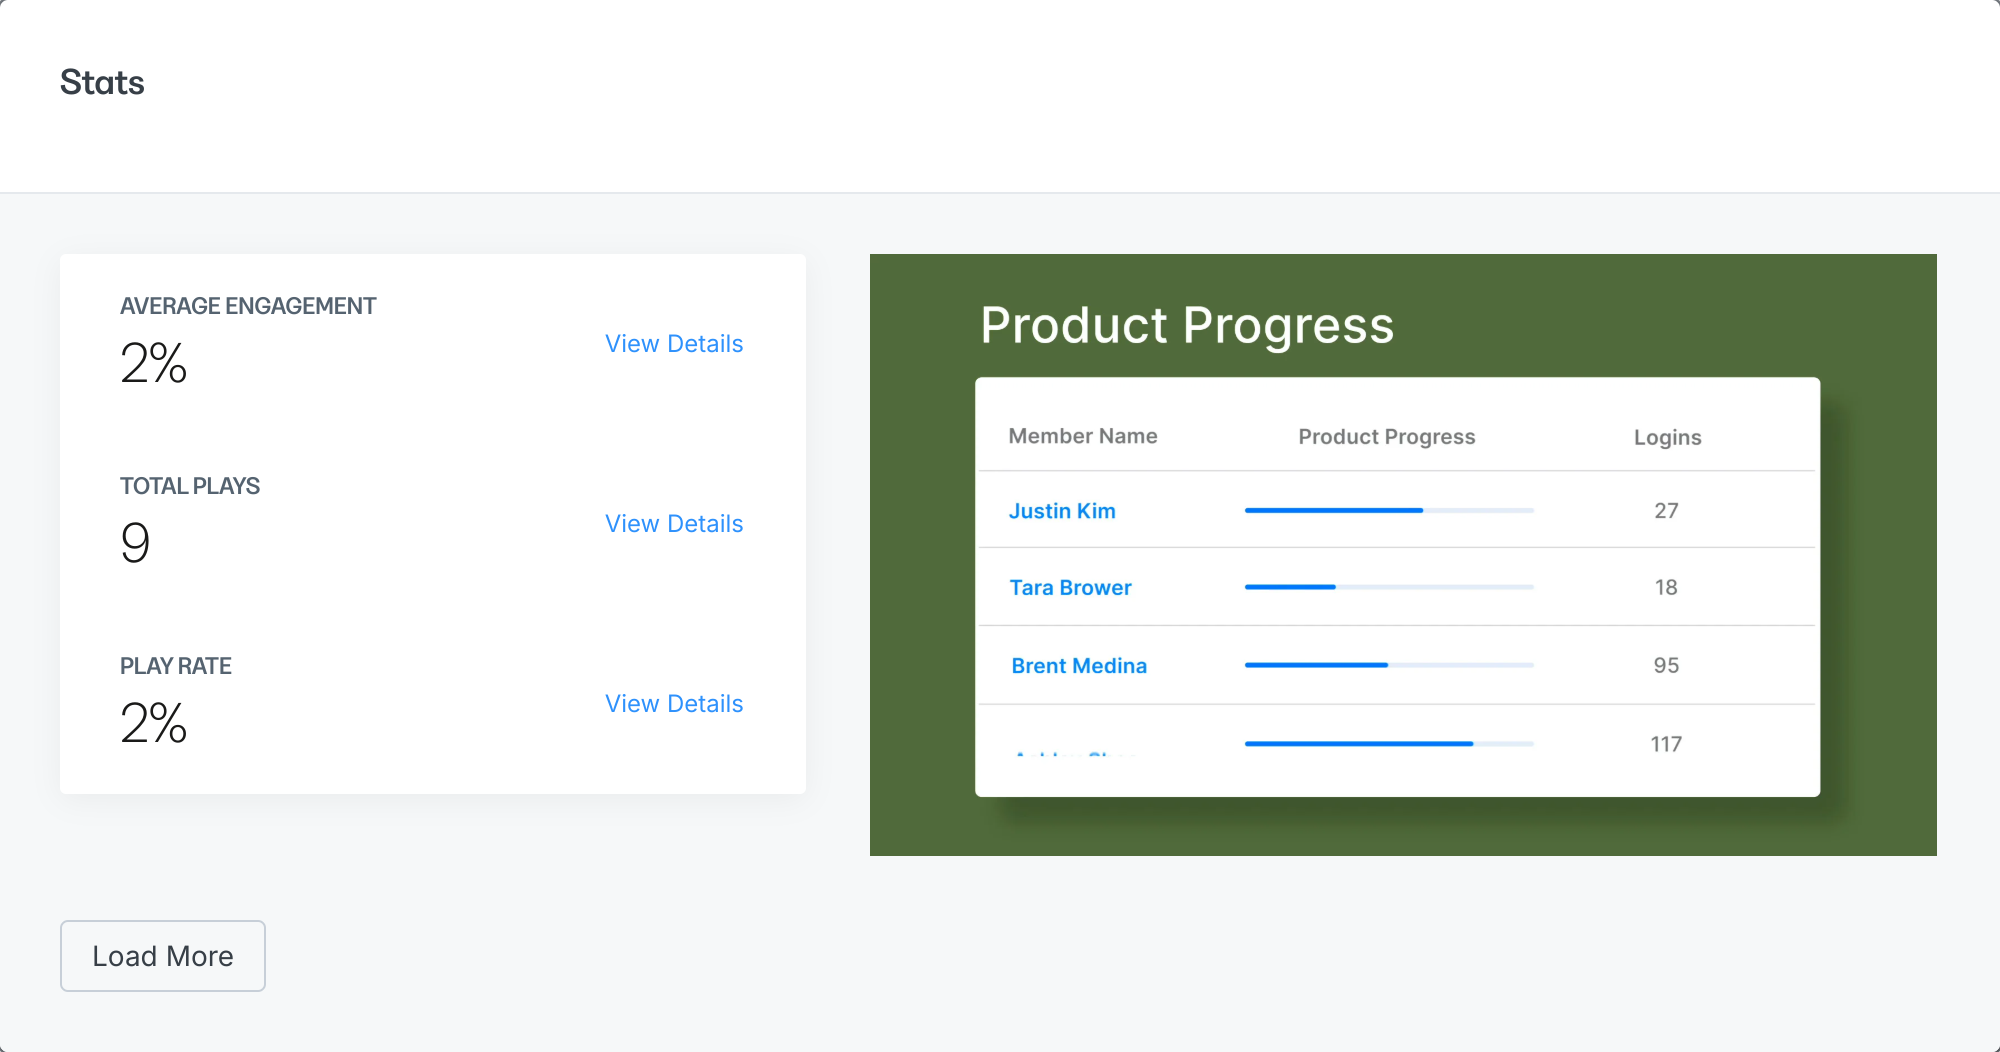
Located in the top right section of your Media Stats, your Summary Stats provide a high-level view of how your media has performed to-date: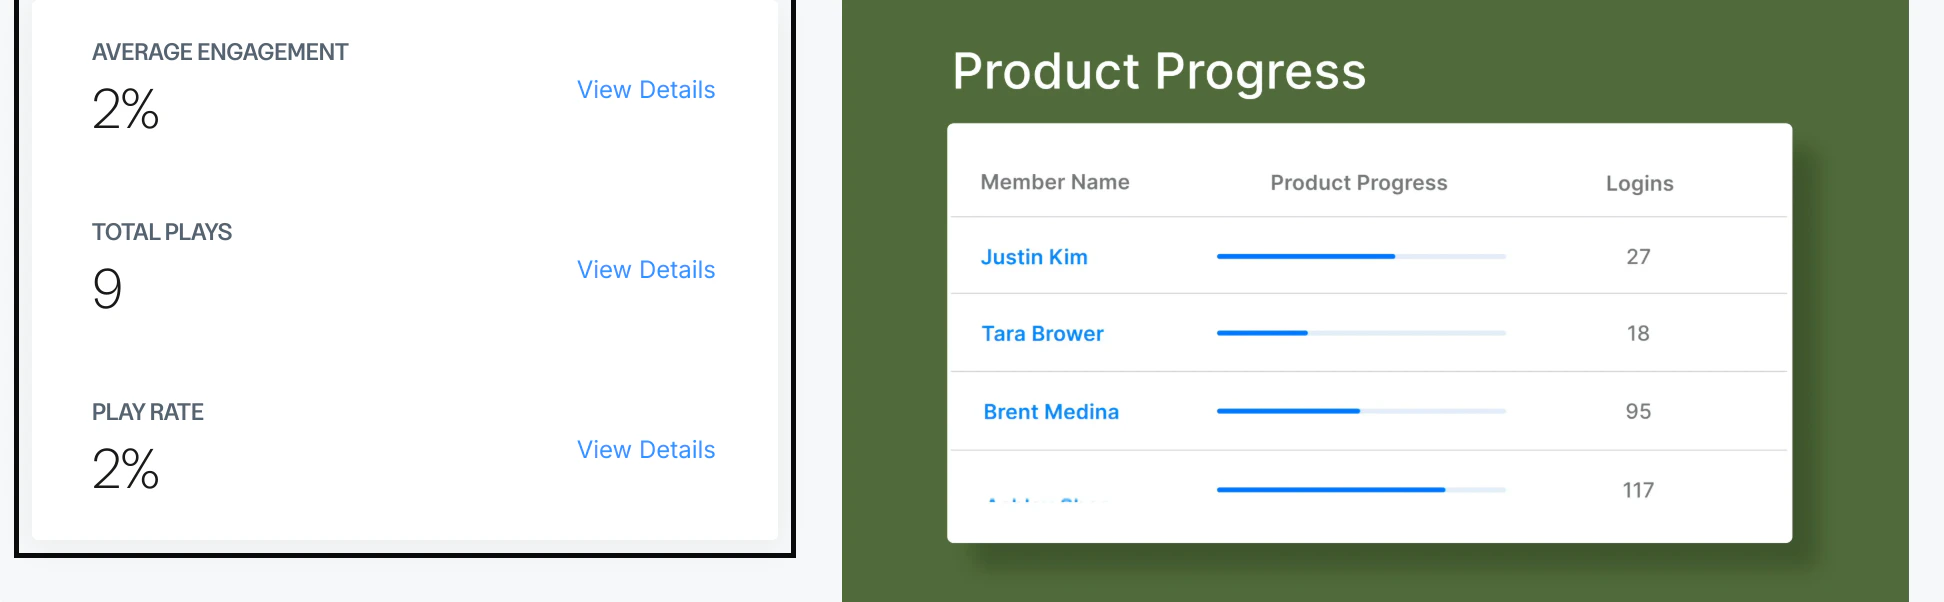
Average Engagement
The Average Engagement is displayed as a percentage to provide insight into how your visitors engage with your media. The percentage is calculated as the time spent engaging with your media (calculated in hours) divided by the product of the total number of plays and the media length.Total Plays
Total Plays displays the total number of times a visitor clicked “play” to engage with your video. This number is calculated each time a visitor plays your media content, not by unique views. Which means if a single visitor engages with your media multiple times, your Total Plays will include each time the visitor played your media. Click View Details to compare the amount of time after uploading your media against the number of Total Plays.Play Rate
The Play Rate is the percentage of time someone who saw the page containing your embedded media spent playing the media. This metric is a great way to measure whether your video is in the best possible context:- Media placement on the page
- Use of a captivating thumbnail image
- Customized player accent color to match your brand
- Surrounding text to encourage your page visitors to click play
Engagement Graph
To the right of your summary stats, you’ll see a preview of your media file. This preview is an interactive engagement graph which allows you to see how your viewers are engaging with your content: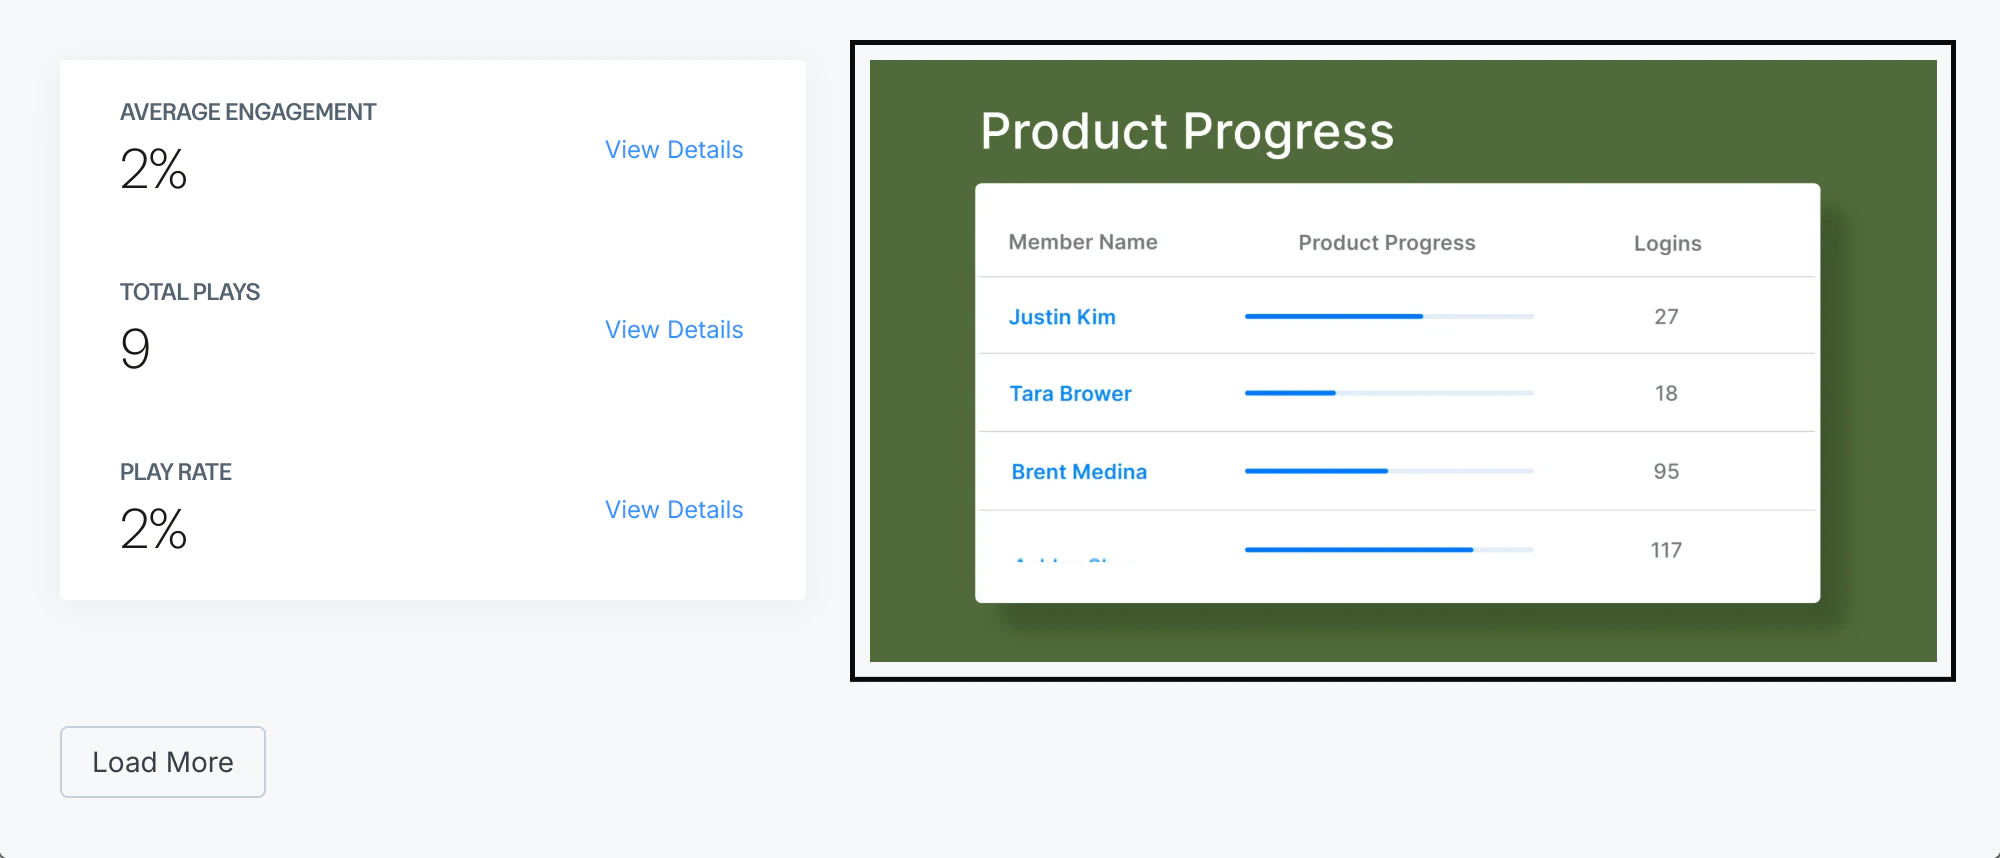
Individual Sessions
Directly below your summary stats and engagement graph, you’ll find a list of individual sessions with a heat map displaying the exact moment an individual stopped playing your media: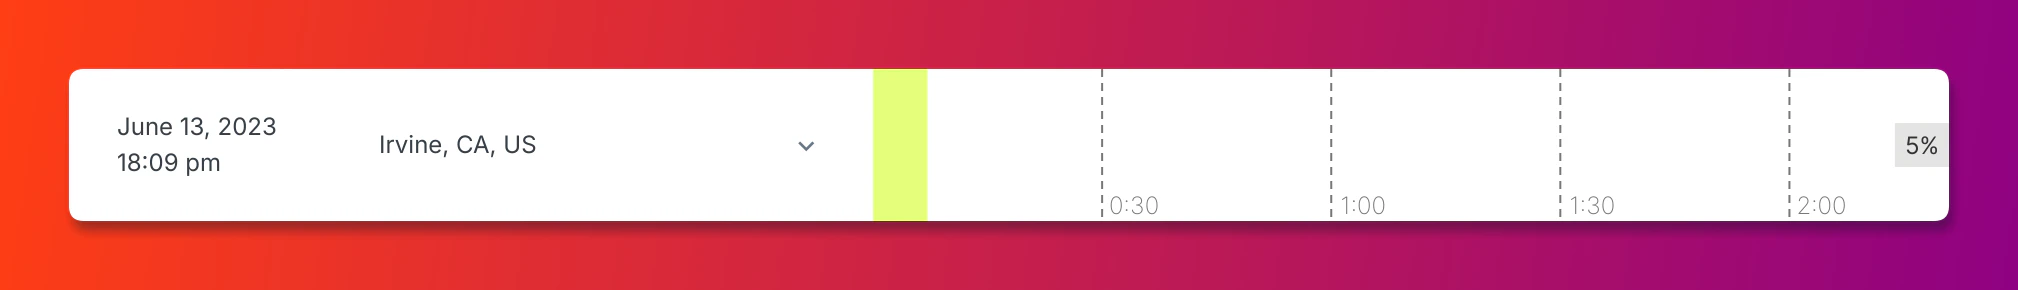
- Type of device used to play your media
- Viewer IP address
- Exact page URL the visitor used to play your media